On this page
Before you measure
Almost every measurement on this page needs elevation data — specifically a DSM (a Digital Surface Model: a grayscale map where every pixel records how high that spot is above sea level). Without a DSM, the platform has no way to know how tall a pile is or where the ground sits, so the measurement buttons won't appear.
You get a DSM in one of two ways:
- If you processed your own photos — turn on Generate DSM/DTM in the Process Imagery window so the platform builds the elevation model for you. (See Processing Imagery.)
- If you imported finished products — include a DSM file when you add them through Tools → Add External Products. (See Add External Products.)
A DTM (Digital Terrain Model — the "bare earth" elevation with buildings and trees removed) is also handy and is what contour lines prefer, but a DSM alone is enough to get started.
Warning: These measurements are estimates, not survey-grade. They're excellent for tracking change over time and for ballpark planning, but you should not rely on them for engineering, legal, or official survey decisions. For anything binding, have a licensed surveyor verify the numbers on the ground.
Measuring a stockpile volume
A stockpile measurement tells you how much material is in a pile — gravel, sand, mulch, dirt, anything heaped up. You draw an outline around the base of the pile, and DataDelivery uses the DSM to estimate the volume inside that outline.
What you'll need first: a processed orthophoto for the site and a DSM (see Before you measure above). An orthophoto is a single, flat, map-accurate photo stitched from all your drone images.
Open the orthophoto and start a stockpile measurement
Open the orthophoto in the GeoTIFF Viewer. Go to the Files tab, open your Products folder, and double-click the orthophoto (the .tif file). It opens in the GeoTIFF Viewer tab. (That viewer tab only appears once you open a .tif — if you don't see it yet, that's normal.)
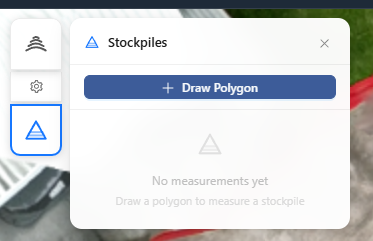
Click the Stockpile button. Look in the top-left of the viewer for the Stockpile button and click it. This opens the Stockpiles panel. (If the button isn't there, the orthophoto has no DSM attached — revisit Before you measure.)
Draw the pile and calculate
Click Draw Polygon. In the Stockpiles panel, click Draw Polygon to start tracing. Your cursor becomes a drawing tool.
Click around the base of the pile. Click point by point all the way around the bottom edge of the pile to outline it, then close the shape (click back on your first point, or double-click) to finish the outline.
Click Calculate. The platform reads the elevations inside your outline and works out the volume. This takes a moment.
Read the results. The results panel shows: Area (the footprint you drew), Fill + (material above the base, in cubic yards), Cut − (any dip below the base, in cubic yards), Net Volume (fill minus cut), and the elevation Min / Max / Mean across the pile.
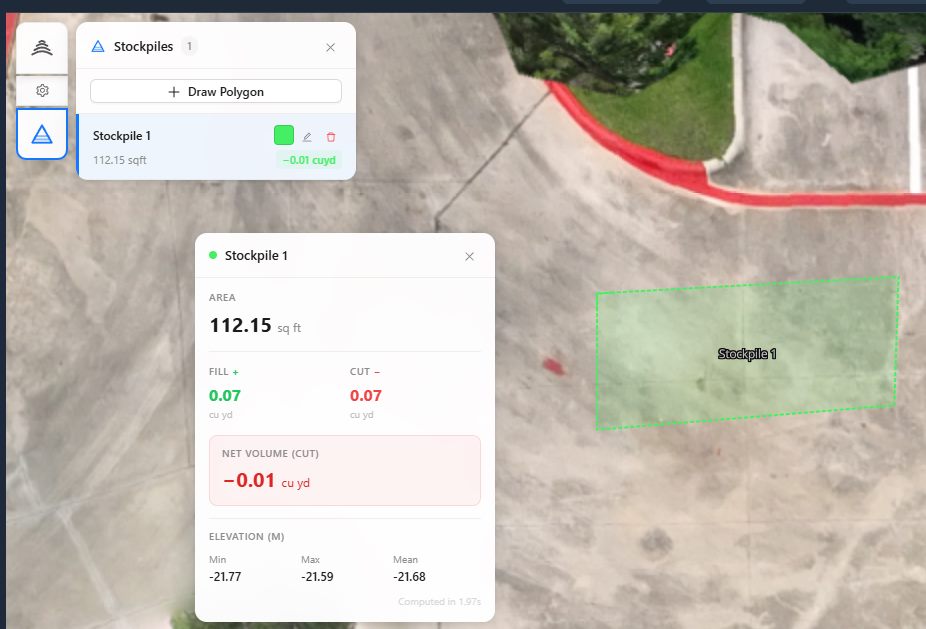
You'll know it worked when… a colored shape covers your pile and the results panel shows a Net Volume figure in cubic yards. Your measurement is also saved to the list in the Stockpiles panel, where you can rename it, change its color, or delete it — and it will still be there next time you open the orthophoto.
Tip: For the best estimate, trace the natural base of the pile — the line where the heaped material meets the flat ground. Cutting the outline too tight leaves material out; drawing it too wide includes ground that isn't part of the pile.
Generating contour lines
Contour lines are the curving lines you see on a topographic map — each line connects points at the same elevation, so close-together lines mean steep ground and far-apart lines mean flat ground. DataDelivery can draw these over your site automatically.
What you'll need first: a DSM or DTM for the site (see Before you measure). Contours are generated from elevation data, so without one the option won't be available.
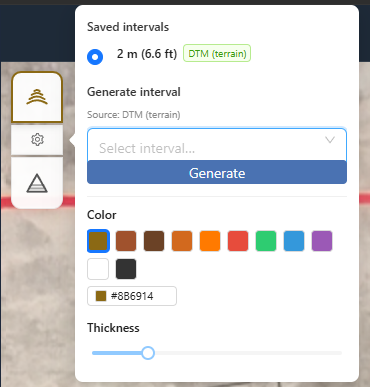
Open the contour settings. In the GeoTIFF Viewer (open your orthophoto from the Files tab first), find the Contours button and the small gear icon next to it. Click the gear to open the contour settings.
Pick an interval. Under Generate interval, choose a spacing from the dropdown. The interval is the height change between two neighboring lines — a smaller interval gives more, tighter lines (more detail); a larger interval gives fewer, cleaner lines.
Click Generate. The platform builds the contour lines at that interval. This processes for a few minutes — you can keep working while it finishes.
Choose which interval to show and style it. Each interval you generate appears in a list with a radio button; click one to display it on the map. You can keep several intervals and switch between them at any time, and you can change the line color and thickness live until they look right.
You'll know it worked when… a web of contour lines appears over your site, the interval you generated shows up in the list with its radio button selected, and adjusting the color or thickness updates the lines instantly.
Note: Contours are smoothest when drawn from a DTM (bare-earth) elevation model. If only a DSM is available, the lines may wrap around buildings, trees, or piles because the DSM includes everything on the surface — that's expected, not a bug.
Measuring in the point cloud
A point cloud is a 3D model of your site made of millions of colored dots, one for each surface point the drone saw. Inside the Point Cloud Viewer you can take measurements directly in 3D — handy for distances and heights that a flat map can't show.
Open the point cloud. In the Files tab, open your Products folder and double-click the point cloud. It opens in the Point Cloud Viewer. (Like the other viewers, this tab only appears after you open a point-cloud file.)
Pick a measurement tool from the toolbar. The viewer's toolbar offers tools for distance, area, height, and angle/azimuth. Click the one you want.
Click points in 3D. Click on the model to drop measurement points — for example, two points for a distance, or several points around an area. The viewer shows the result as you go. Rotate and zoom the model with your mouse to place points accurately.
You'll know it worked when… your points appear on the 3D model with a live readout (a distance, area, height, angle, or volume) shown alongside them.
Related: Viewing Your Deliverables
New to opening point clouds and the 3D viewer? Start here for how to open each file type and move around in 3D.
Read guide →Was this page helpful?
Thanks for the feedback! It helps us improve the guide.
Still stuck?
We’re happy to help — email us and a real person will get back to you.
contact@nationaldroneservices.net