On this page
What a report is
A report in DataDelivery is a shareable web page built from one job’s data. You choose what goes into it — an interactive orthophoto (a single, flat, map-accurate photo of the whole site, stitched from all your drone images) map, a before/after comparison, your measurements, annotated photos, and your own written sections — and the platform assembles it into a clean page you can show off.
A few things worth knowing up front:
- You decide what’s included. A report only shows the pieces you turn on, so you can keep it focused on what your client cares about.
- You can make several per job. For example, one detailed internal report and one simple summary for the client — both live under the same job.
- You share it with a private link. When you’re ready, the platform generates a private web link you send to your client.
- Your client doesn’t need an account. They just open the link in any web browser — no sign-up, no password, no DataDelivery login.
Creating a report (step by step)
What this is: building a new report from a job’s data by filling in a short form — naming it, turning on a map, and adding the optional sections you want.
What you’ll need first: a job that already has at least one finished product (most reports center on an orthophoto). If you haven’t made one yet, process your photos first — see Processing Imagery — or bring in a finished one via Add External Products.
Open the job and go to the Reports tab. From My Personal Jobs in the sidebar, click the job you want a report for. Across the top of the job you’ll see its tabs — click the Reports tab.
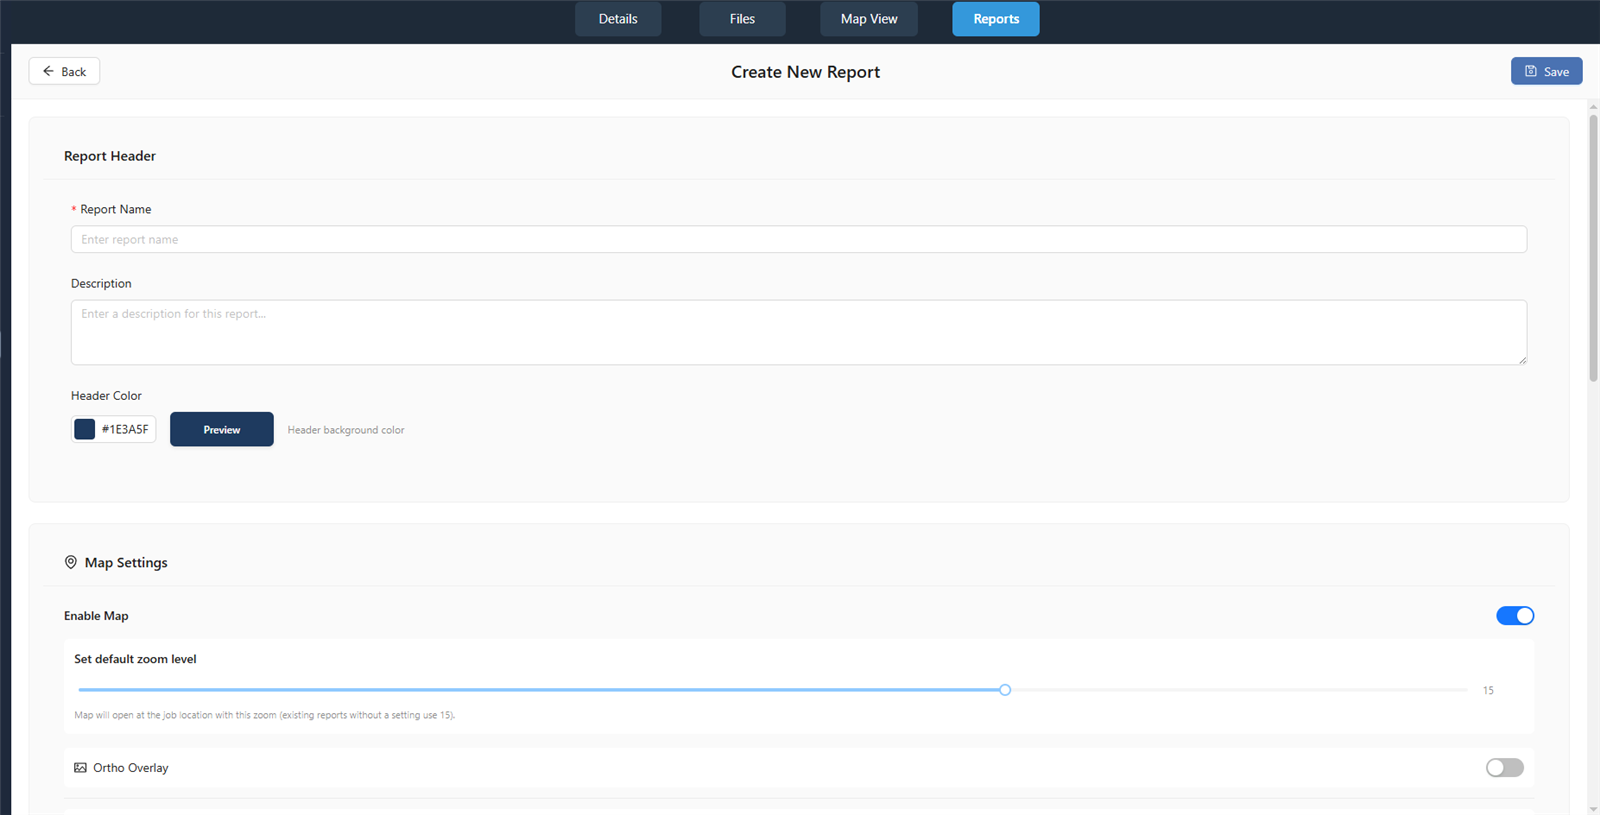
Start a new report. Click Create New Report. A form opens where you’ll set everything up.
Name your report. Type a Report Name — this field is required (for example, “North Field — June Progress”). You can also add an optional Description and pick a Header Color to brand the top of the page.
Turn on the map. Under Map Settings, switch on Enable Map. This adds an interactive map to your report — the centerpiece of most reports.
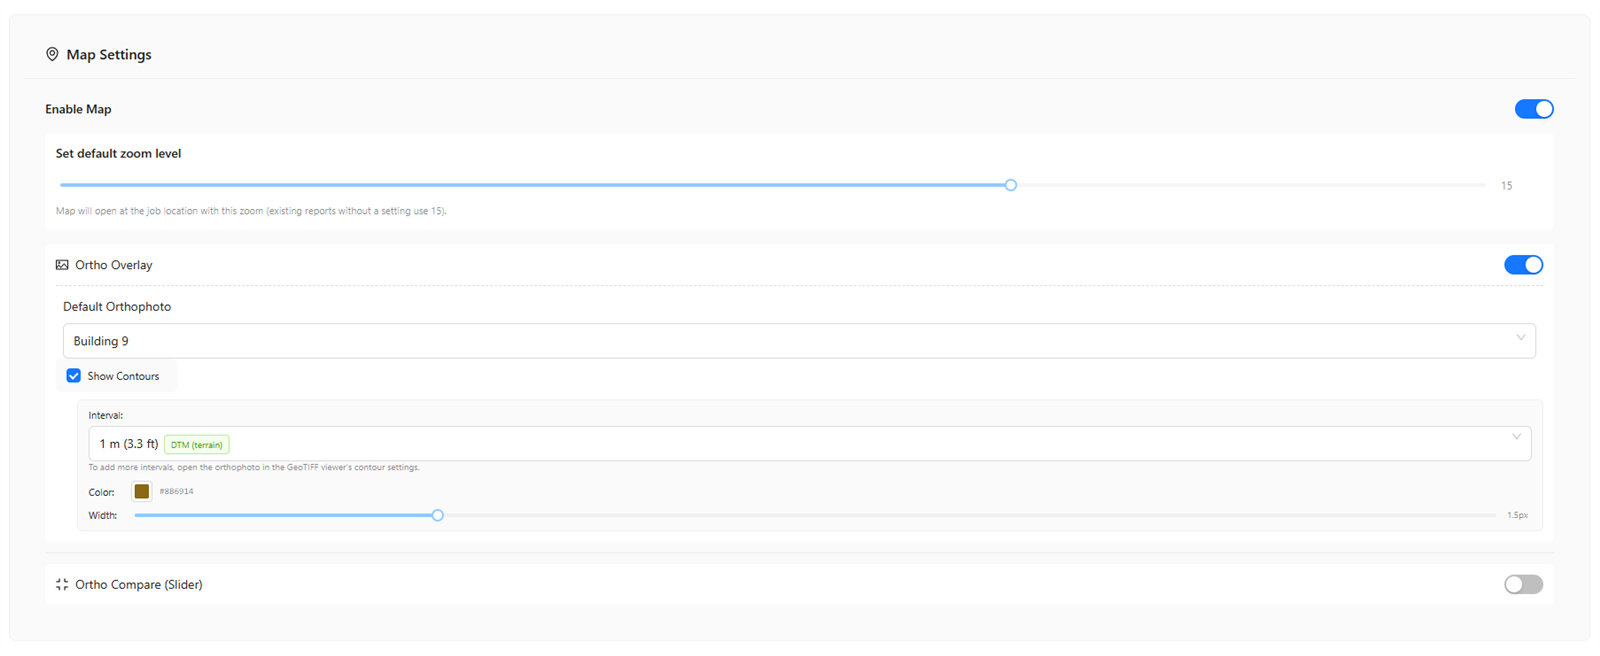
Choose your map style. Pick one of two options:
- Ortho Overlay — shows a single orthophoto laid over the map. If that orthophoto has contour lines (the curved lines that connect points of equal elevation), you can tick Show Contours and then choose an Interval (how far apart the lines are), plus a line color and width.
- Ortho Compare (Slider) — shows a before/after slider your client can drag to wipe between two orthophotos. Pick a Left Orthophoto and a Right Orthophoto (for example, last month vs. this month).
Add optional sections. Below the map settings you can switch on extra sections to round out the report:
- 2D Measurements — includes the distances and areas you measured on the map.
- Annotated Imagery — includes your marked-up photos; you’ll choose which capture’s annotations to show (a capture is one dated visit to the site).
- A point cloud section — embeds the 3D point cloud (a 3D model made of millions of colored dots) so clients can explore it.
- Custom Section — your own block with a title and text you type in, for notes, context, or next steps.
Drag the sections up or down to set the order they appear in the finished report.
Save it. Save the form. Your new report now appears in the list on the Reports tab, ready to view or share.
Note: If you don’t have an orthophoto yet, there’s nothing to put on the map. Make one first by following Processing Imagery, then come back and create your report.
You’ll know it worked when… your new report appears by name in the list on the Reports tab, with its own menu for viewing and sharing.
Viewing a report
What this is: opening a report you’ve created to see exactly what your client will see.
Find it in the list. On the Reports tab, locate the report by name.
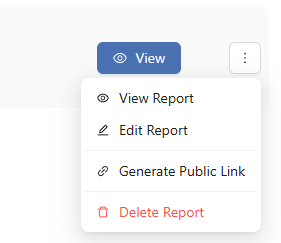
Open it. Click the ⋮ (three-dot) menu next to the report, then choose View Report. The report opens so you can scroll through the map, slider, measurements, annotated photos, and any sections you added.
Tip: Always view a report yourself before you send the link — it’s the quickest way to confirm the right orthophoto, comparison, and sections are showing.
You’ll know it worked when… the report opens as a full page showing your map and the sections you turned on, exactly as a client would see them.
Sharing with your client
What this is: creating a private web link to your report and sending it to your client. They open it in any browser — no account, no login.
Open the report’s menu. On the Reports tab, click the ⋮ (three-dot) menu next to the report.
Generate the link. Choose Generate Public Link. The platform creates a private link and copies it to your clipboard automatically — ready to paste straight into an email or message.
Send it to your client. Paste the link into an email, text, or chat. When your client clicks it, the report opens in their browser — no DataDelivery account, no password, nothing to install.
Once a report is shared, the same ⋮ menu gives you three more controls so you stay in charge of who can see it:
- Copy Public Link — copies the current link again, any time you need it.
- Regenerate Link — creates a brand-new link. The old link immediately stops working, so this is how you cut off access for anyone who had the previous one.
- Disable Public Link — turns sharing off completely; the report goes private again and the link no longer opens.
Tip: Need to revoke access? Use Regenerate Link at any time — it instantly invalidates the old link so anyone holding it can no longer open the report. Then send the fresh link only to the people who should still have it.
You’ll know it worked when… the link is copied to your clipboard and, when you paste it into a new browser tab, the report opens without asking you to log in.
Sharing the whole job (optional)
Reports are the polished, curated way to present results — but sometimes you want a client to browse the raw data directly instead. Besides reports, you can share access to an entire job with a client.
Open the job’s Details tab. Inside the job, click the Details tab across the top.
Share it with your client. From the Details tab, share the job so the client can open it and browse the files, products, and map themselves.
Note: Sharing a whole job gives a client a fuller, less curated view than a report. Reach for a report when you want a clean, focused presentation; share the job when the client needs to dig through everything.
What’s next? Now that your work is shared, keep your account tidy — recover deleted files, free up space, and explore a few extra tools in Storage, Recycle Bin & Tools.
Next: Storage, Recycle Bin & Tools
Recover deleted files, free up space when you hit your storage limit, and use handy extras like the 3D Path Viewer.
Read guide →Was this page helpful?
Thanks for the feedback! It helps us improve the guide.
Still stuck?
We’re happy to help — email us and a real person will get back to you.
contact@nationaldroneservices.net