Web reports built from your own job
Build interactive web reports from a job's data, choosing and ordering sections such as image comparisons, 2D measurements, annotated imagery, imagery, videos, 360 panoramas, 360 tours, point cloud, stockpiles and custom text.
You build each report yourself, from the photos, maps, measurements and annotations already in the job. A job can have more than one report, so a site manager and an owner can each get the sections they need.
Open the sample report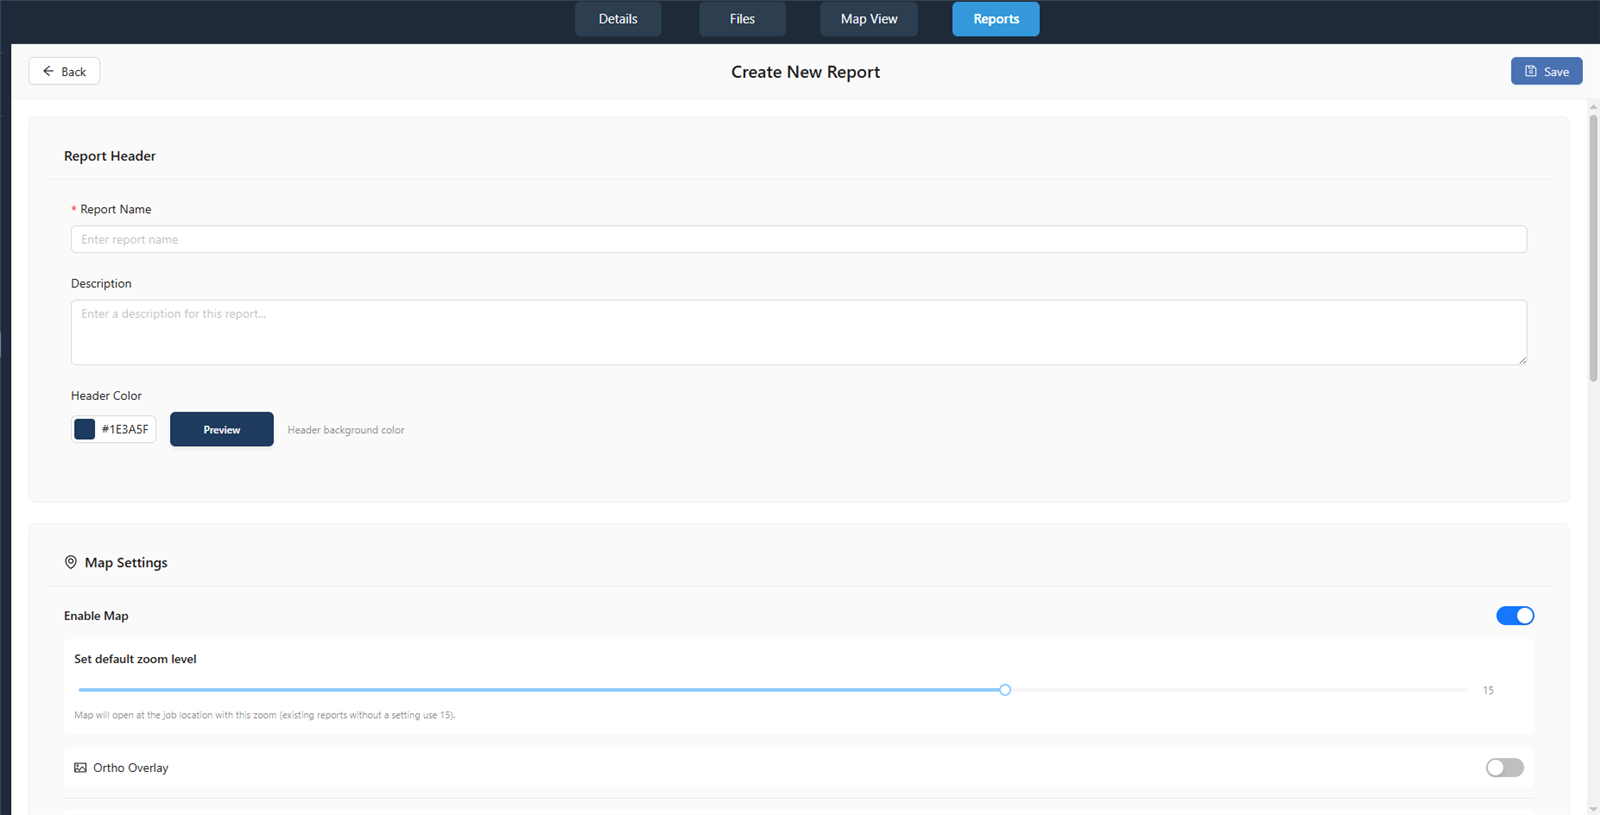
Share a report with a no-login link
- Share any report you build as its own no-login link, and switch it off or revoke it whenever you want.
- Post a report straight to Facebook, X or LinkedIn. Shared report and job links show a preview card in apps like Slack, WhatsApp, iMessage and LinkedIn, using a map image of the site when one is available.
- See what each invited client opened and downloaded on a job, from maps and orthomosaics to point clouds, 360 panoramas and reports. Public-link visits show as a view count.
A report link is separate from the job link. One no-login link per job covers the files, maps and imagery from every dated site visit, on every plan. Reports have their own links, and point clouds are switched on per link. No-login job links are view-only by default; invited clients you add to a job can download the files you allow.
Comparing ways to send files? Read how to deliver drone data to clients.
PDF Site Reports for a site visit
Generate a PDF Site Report for one site visit from the Reports tab: pick the visit and the annotations to include.
The PDF has a cover, a site overview showing where the annotated photos were taken, measurement pages when that visit has saved measurements, and a page for each annotated photo with your markup and each annotation's name, description and severity.
The finished PDF is saved in the job's Reports folder. On your own jobs it carries your business name, your logo on plans that include logo branding, and a small "Powered by DataDelivery" line on the Starter and Basic plans.
Construction progress reports
A drone construction progress report shows the owner or contractor what changed on site between visits.
- Each job holds multiple dated site visits (captures) on a timeline, so recurring work stays in one place.
- Build the report from sections such as imagery, image comparisons, 2D measurements and point cloud.
- In the job, clients you invite by email can compare two orthomosaics with a before and after slider, see photos taken from the same spot on different dates when you fly repeatable shots, and compare two point clouds side by side.
For repeat site visits, see the construction progress portal.
Report types
Condition reports and punch lists
Mark up drone photos with rectangle or polygon annotations, each with a name, description and a 1 to 10 severity, and reuse common labels from your annotation glossary.
Add an annotated imagery section to a web report, or generate a PDF Site Report for the visit with the annotations you pick.
If you deliver inspection work, see how to send inspection photos to clients.
Stockpile reports
Trace the base of a pile on the orthomosaic to estimate fill, cut and net volume in cubic yards, plus min, max and mean elevation. Results are estimates for inventory tracking, not surveyed quantities.
Stockpiles need a surface model (DSM), from NDS Processing or imported with your orthomosaic. Add a stockpiles section to a web report to show the results to your client.
Measurements are approximate and are not a substitute for a licensed surveyor.
Step by step: how to measure stockpile volume with a drone.
How to build a report for a client
You build the report from the job; your client opens it in a browser.
-
1
Collect the job data
Drag in individual files, large batches or whole folders straight from the browser, with your folder structure kept. Each site visit becomes a dated capture on the job's timeline.
-
2
Process or import your maps
Run NDS Processing on overlapping drone photos, or import a finished orthomosaic, DSM, DTM or LAS/LAZ point cloud from other software.
-
3
Add your markup
Annotate photos, and measure distance, area and perimeter on the map. Save measurements as named layers per site visit. Figures are approximate.
-
4
Choose the report sections
Open the job's Reports tab, create a report, and choose and order the sections your client needs.
-
5
Send the link
Share the report as its own no-login link. You can switch it off or revoke it whenever you want.
-
6
Add a PDF Site Report when needed
Generate a PDF Site Report for one site visit from the Reports tab: pick the visit and the annotations to include.
DataDelivery's plans can be paid monthly or yearly, and each starts with a 7-day free trial.
See current DataDelivery plansDrone client reports: common questions
Do I have to build a report to deliver a job?
No. You can share the job itself, by email invite or with a no-login link. One no-login link per job covers the files, maps and imagery from every dated site visit, on every plan. Reports have their own links, and point clouds are switched on per link.
Does my client need an account to open a report?
No. Share any report you build as its own no-login link, and switch it off or revoke it whenever you want.
Can one job have more than one report?
Yes. You can build several web reports from the same job's data, each with its own sections, and share each one as its own no-login link.
Is a PDF Site Report the same as a web report?
No. A web report is an interactive page you build from sections and share as a link. A PDF Site Report covers one site visit: you pick the visit and the annotations to include, and the finished PDF is saved in the job's Reports folder.
Can I put my logo on reports?
Yes, starting on the Basic plan: put your own logo on client-facing pages and emails. On your own jobs, the PDF Site Report carries your business name, your logo on plans that include logo branding, and a small "Powered by DataDelivery" line on the Starter and Basic plans.
Can I include stockpile volumes in a report?
Yes. Add a stockpiles section to a web report. Stockpile volumes are estimates for inventory tracking, not surveyed quantities. Measurements are approximate and are not a substitute for a licensed surveyor.
Related
Build your first client report on a 7-day free trial
7-day free trial, card required, cancel anytime.