Drone volume measurement turns overlapping aerial photos into a 3D surface, then calculates how much material sits above a base surface. The calculation is only half the job. Clients also need the result organized by site and date, comparable with last month’s flight, and easy to open without extra software. That is what DataDelivery™ is built for: our platform keeps your captures, stockpile and contour measurements, annotations and reports in one place, delivered to clients under your brand.
TL;DR
- Drone volume measurement means capturing overlapping images, building a point cloud and elevation model, outlining the pile, and calculating volume above a chosen base surface.
- Peer-reviewed field studies report volume errors of roughly 1% to 3% against ground survey methods when ground control and checkpoints are used.
- The base surface and ground control matter more than the drone itself. A wrong base is a common source of error.
- Volume is cubic yards or meters. Tons require a density factor for the material.
- Repeatable results across visits depend on consistent flights, and on keeping every capture organized by site and date so changes are easy to compare and report.
Table of Contents
- What drone volume measurement actually measures
- From flight to volume: the workflow step by step
- The base surface decides the answer
- How accurate is it?
- Tracking change over time
- Delivering volumes your clients can use
- Who benefits, and how
- Why a purpose-built platform beats a pile of files
- Our perspective
- Start with the plan that fits your volume of work
- FAQ
- Sources
What drone volume measurement actually measures
A drone survey does not weigh anything. It records the shape of a surface. Software compares the top of a pile (or the floor of an excavation) with a reference surface underneath and calculates the space in between. That space is volume, expressed in cubic yards or cubic meters.
The method applies wherever material is stored, removed or added:
- Stockpiles of aggregate, sand, soil, coal, mulch or scrap.
- Excavations and cut-and-fill areas on construction sites.
- Landfill cells and quarry faces, where remaining capacity or removed volume matters.
Official survey guidance reflects this range. India’s government standard procedure for UAV surveys lists volumetric estimation of excavation, reclamation and stockpile monitoring among core drone survey applications. It also sets minimum image quality: an RGB camera of at least 20 megapixels capable of a ground sample distance under 5 cm, and an elevation model of 15 cm per pixel or better for mining surveys. Ground sample distance (GSD) is the size on the ground of one image pixel. Smaller means more detail.
For most readers of this article, whether you fly for clients, run construction projects or manage properties, the practical question is simple: how do I get a number I can trust, and how do I show it to someone else?
From flight to volume: the workflow step by step
Every photogrammetry workflow follows the same chain. Here is where each step can go wrong, and what to do about it.
1. Plan the flight
Fly a grid pattern over the pile and its surroundings with generous overlap between photos, so every point on the surface appears in many images. Include the ground around the pile, because the software needs that ground to estimate what lies under the material. Steep sides and tall piles need extra care: fly lower, or add oblique passes, so the faces are captured and not only the top.
Where it goes wrong: low overlap leaves holes in the model, and holes become guesses in the volume.
2. Set ground control
Ground control points (GCPs) are marked targets on the site whose coordinates are measured with survey-grade equipment. They anchor the model to real-world positions and elevations. Checkpoints are extra targets that are not used to build the model but to test it afterward.
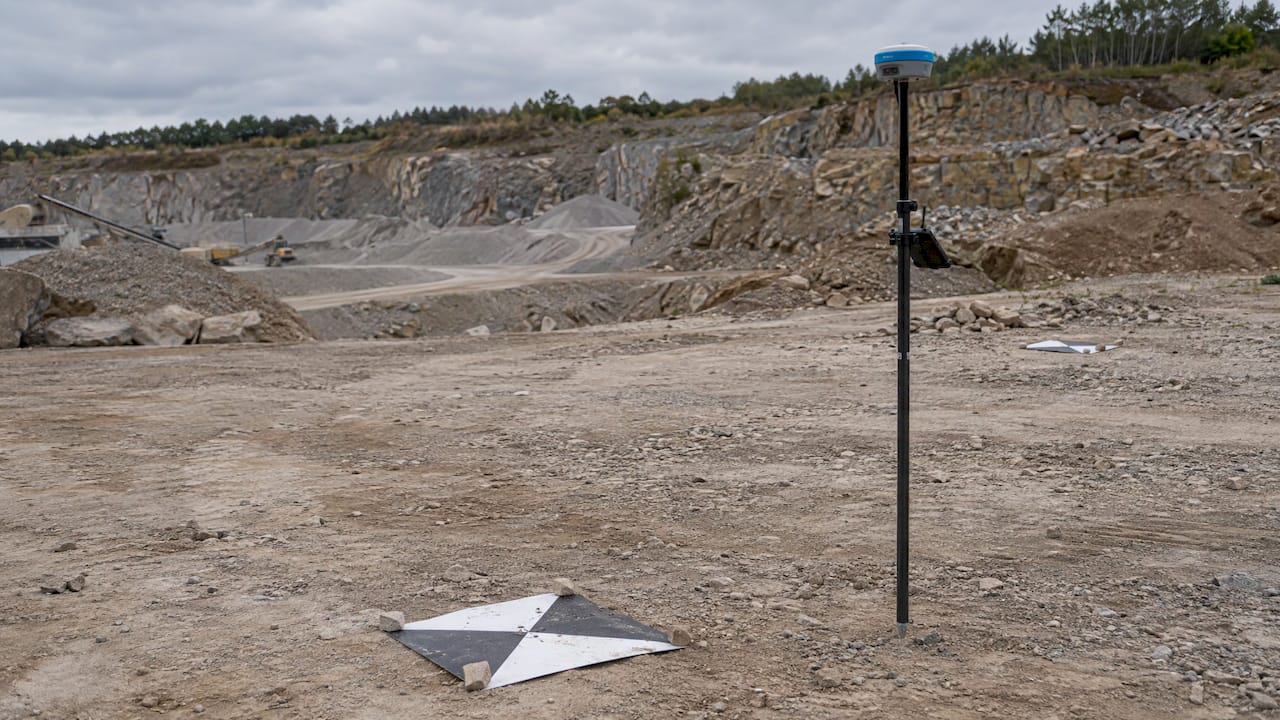
The field evidence supports this. In a 2022 comparison of drone and traditional volume methods at a quarry in Malawi, the team used 164 images and five GCPs, and reported that smaller checkpoint error improved model accuracy and the reliability of measurements.
Where it goes wrong: targets bunched on one side of the site, or targets that move between flights. If you want to compare volumes month to month, keep the targets in the same locations.
3. Process the images
Software aligns the photos, builds a point cloud (millions of 3D points), and produces an orthomosaic (a distortion-corrected top-down map) and an elevation model. The elevation model must preserve the pile’s real geometry. Dark, shiny or uniform-looking materials are harder for photogrammetry to reconstruct, so check the model visually before you trust the number.
With DataDelivery, processing happens on the platform, which generates orthomosaics and point clouds from your uploads. You do not need separate image processing software to get from raw photos to something a client can open.
4. Outline the pile and choose a base surface
You draw a boundary around the material and tell the software what the pile sits on. This is the step most people underestimate, so it gets its own section below.
5. Read the volume and record it
The tool reports volume for the outlined area. Save it with the date, the site, the base method and the material. A number without that context cannot be compared with next month’s number.
Our Measurements & Analysis guide walks through the stockpile and contour tools on the platform, and the stockpile measurement page shows how the results connect to client reporting.
The base surface decides the answer
The software cannot see under the pile. It estimates the base from the ground around it, and your choice of method changes the result. The three common approaches:
| Base method | Best for | Watch out for |
|---|---|---|
| Flat or best-fit plane | Isolated piles on level, open ground with a visible boundary | Slopes, which tilt the plane away from reality |
| Lowest point | Piles in bins, against walls or on sloped ground | Can understate volume if the lowest point is a dip |
| Triangulated surface (TIN) | Large piles or irregular ground with a visible boundary all around | Needs the full perimeter visible, not hidden by walls or equipment |
A 2024 geodetic study of a coal stockpile in Nigeria found that triangulated volume surfaces gave the most consistent results across three different software packages for a cone-shaped pile, and were suited to cases where the full boundary is visible and the surface relatively flat.
A practical rule: choose the base method per pile, write it down, and use the same method on the same pile every time. Switching methods between visits creates change that never happened on site.
How accurate is it?
Accuracy depends on ground control, image resolution and base surface. The published field studies give a realistic range.
- Quarry stockpile, Malawi (2022). The drone method’s volume error against the actual volume was 2.6%, versus 1.3% for the traditional approach. Both fell within the plus or minus 3% maximum allowable error. The average GSD was 1.44 cm. Drone data collection took 35 minutes against 97 minutes for the tape-based method. (Frontiers in Built Environment)
- Coal stockpile, Nigeria (2024). The UAV survey gave 3,060.82 m³ against 2,979.92 m³ from a GNSS RTK ground survey, a difference the authors report as 2.79%, within the plus or minus 3% limit they apply. (International Journal of Research)
- LiDAR-equipped drones (2025). A multi-drone system reached an average volumetric error of 1.3% in less than half the flight time of a single static-sensor drone, while an actuated LiDAR approach showed 4.4% error, attributed to surface reconstruction outliers and LiDAR bias at non-vertical scan angles. (MDPI Aerospace)
The takeaway is not that one method always wins. It is that a well-run photogrammetry survey with ground control lands in the same range as ground-based methods, in a fraction of the field time and without anyone walking on an unstable pile.
A worked example
Suppose a yard holds a sand pile that your survey measures at 3,000 cubic meters. If the true volume is within 3%, the answer is between about 2,910 and 3,090 cubic meters, a spread of around 180 cubic meters. For inventory planning that is usually fine. For a billing dispute, it is the reason to document ground control and checkpoints in the report, so the number carries its own evidence.
From volume to tons
Volume is geometry. Weight is volume multiplied by the material’s bulk density, and density changes with material type, moisture and compaction. Freshly dumped material weighs less per cubic meter than settled stock. If clients want tons, agree on a density figure with them, record it in the report, and update it when the material or its moisture changes.
Tracking change over time
A single volume is a snapshot. Most clients want the trend: how fast the pile is growing, how much was removed this month, how much cut and fill remains. That means repeated surveys of the same site, and three habits make them comparable:
- Keep flight parameters consistent. Same altitude, overlap and pattern where possible.
- Keep ground control in the same places. Re-measured targets that sit where they did last time make differences real.
- Keep the base method and boundaries constant. Outline the same pile the same way.
Academic work on waste-collection sites supports this approach. A 2019 study in Remote Sensing monitored stockpile volumes with repeated UAV flight sessions, using a terrestrial laser scanner for ground control and ground truth, and compared results across software and flight configurations.
This is where organization matters as much as measurement. A folder of files named “final_v2” does not support trend reporting. DataDelivery organizes every capture by property, site and date, with map-based and timeline browsing and time-series comparison, so you can put this month next to last month without hunting for files.
Delivering volumes your clients can use
The measurement is only valuable once the person who pays for it can see it. A client cares about three things: where the pile is, what changed, and what the number is. A spreadsheet answers the third and none of the others.
With DataDelivery you can:
- Share a client portal under your own brand. We do not charge per-seat fees, and your clients do not need accounts to view what you share.
- Let clients browse by map or timeline, and open orthomosaics, 3D models and point clouds in the browser. See our pages on sharing orthomosaics with clients and sharing point clouds with clients.
- Add annotations on imagery to mark the pile, the haul road or the area of concern, as covered in the annotating imagery guide.
- Generate reports for stakeholders, as explained in the Reports & Sharing guide.
If you already process data in other mapping software, you can bring those products in as well. The external products guide shows how.
Who benefits, and how
Drone service providers. One platform replaces the patchwork of processing software, file transfer links and PDF reports. Your clients see a branded, organized delivery, and you spend less time answering where a file went. Recurring capture management helps with monthly stockpile contracts.
Construction firms. Progress tracking is volume tracking: earth moved, material delivered, material remaining. Time-series comparison of captures shows where the site stands against plan. Our construction page describes turnkey aerial data for these projects.
Property managers. Not every property manager measures piles, but many need organized visual records of sites, roofs and grounds, and some track landscaping or aggregate materials. A dated, map-based archive makes documentation simple. See our property management page.
Why a purpose-built platform beats a pile of files
Generic file-sharing tools store drone data. They do not understand it. They cannot show a property’s history on a map, compare two dates side by side, or measure a pile in the viewer. When volume work becomes recurring, the gap shows up in small ways: a client asks for last quarter’s number and you rebuild it from archives, or two people outline the same pile differently.
With a platform that keeps measurement, imagery and reporting together, the survey, the number and the evidence travel as one record. Our platform update post covers the stockpile and contour tools and the advanced processing we added.
Our perspective
We built DataDelivery around one observation: the flight is rarely where drone volume work succeeds or fails for a client. It is the delivery. A correct number buried in a download link is a number the client cannot act on.
That is why we organize everything by property, site and date from the first upload. Volumes, contours, annotations and reports sit beside the imagery they came from. When a construction manager asks how much material moved since the last visit, the answer is two captures on a timeline, not a search through email.
We also think providers should not pay more each time they add a person to a project or invite a client to look. DataDelivery has no per-seat fees and no required client accounts, so the portal you share can carry your brand and your relationship, not ours.
Measurement discipline still belongs to the pilot: ground control, consistent base surfaces, a documented density for tons. The platform’s job is to make that discipline visible and repeatable, so every volume you deliver arrives with its context.
the author
Start with the plan that fits your volume of work
DataDelivery has a self-serve plan for each stage of a drone business. Plans are tiered by usage limits such as jobs, processing runs and storage, and they are listed on our pricing page:
| Plan | Monthly | Yearly |
|---|---|---|
| FREE | $0 per month | not applicable |
| Starter | $12.99 per month | $129 per year |
| Basic | $29.99 per month | $299.99 per year |
| Premium | $79.99 per month | $799.99 per year |
| Enterprise | $199.99 per month | $1,999.99 per year |
If you would rather not fly the site yourself, our Turnkey Capture service handles aerial data capture and processing as a per-job service through the online portal. Start at the National Drone Services home page or explore the DataDelivery platform.
Once a site is set up, repeat captures slot into the same timeline, so your second and tenth volume measurement take less effort than your first.
FAQ
How accurate is drone volume measurement?
Published field studies report errors of about 1% to 3% against ground-based methods when ground control points and checkpoints are used. A 2022 quarry study measured 2.6% error for the drone method, inside the plus or minus 3% limit it applied. Accuracy falls without ground control, and an incorrect base surface can add error.
Can a drone measure weight as well as volume?
A drone measures volume. Weight comes from multiplying that volume by the material’s bulk density, which changes with material type, moisture and compaction. Record the density you used in the report so the tonnage can be updated when the material changes.
Do I need ground control points for every survey?
Ground control is what ties the model to real elevations, and the Malawi quarry study used five GCPs and checkpoint testing to document accuracy. For volumes that feed billing or inventory records, include control and checkpoints. For repeat surveys, keep the target locations consistent.
How do I compare volumes from different dates?
Keep flight settings, ground control locations, pile boundaries and the base surface method the same each time. Then store each capture by site and date. In DataDelivery, the timeline and time-series comparison tools let you review captures from different dates together.
Do my clients need an account to see the results?
No. DataDelivery client portals can be shared without requiring client accounts, and we do not charge per-seat fees. The portal can carry your branding.
Sources
- Final SOP of UAV Survey (India)
- Comparative utilization of drone technology vs. traditional methods, Frontiers in Built Environment, 2022
- Geodetic Investigation of Coal Stockpile Volume, International Journal of Research
- Experimental Evaluation of Multi- and Single-Drone Systems, MDPI, 2025
- Monitoring and Computation of the Volumes of Stockpiles, Remote Sensing, 2019